First, read the Disclaimer and User Agreement, and click the button to accept the terms and view the Beluga sightings.
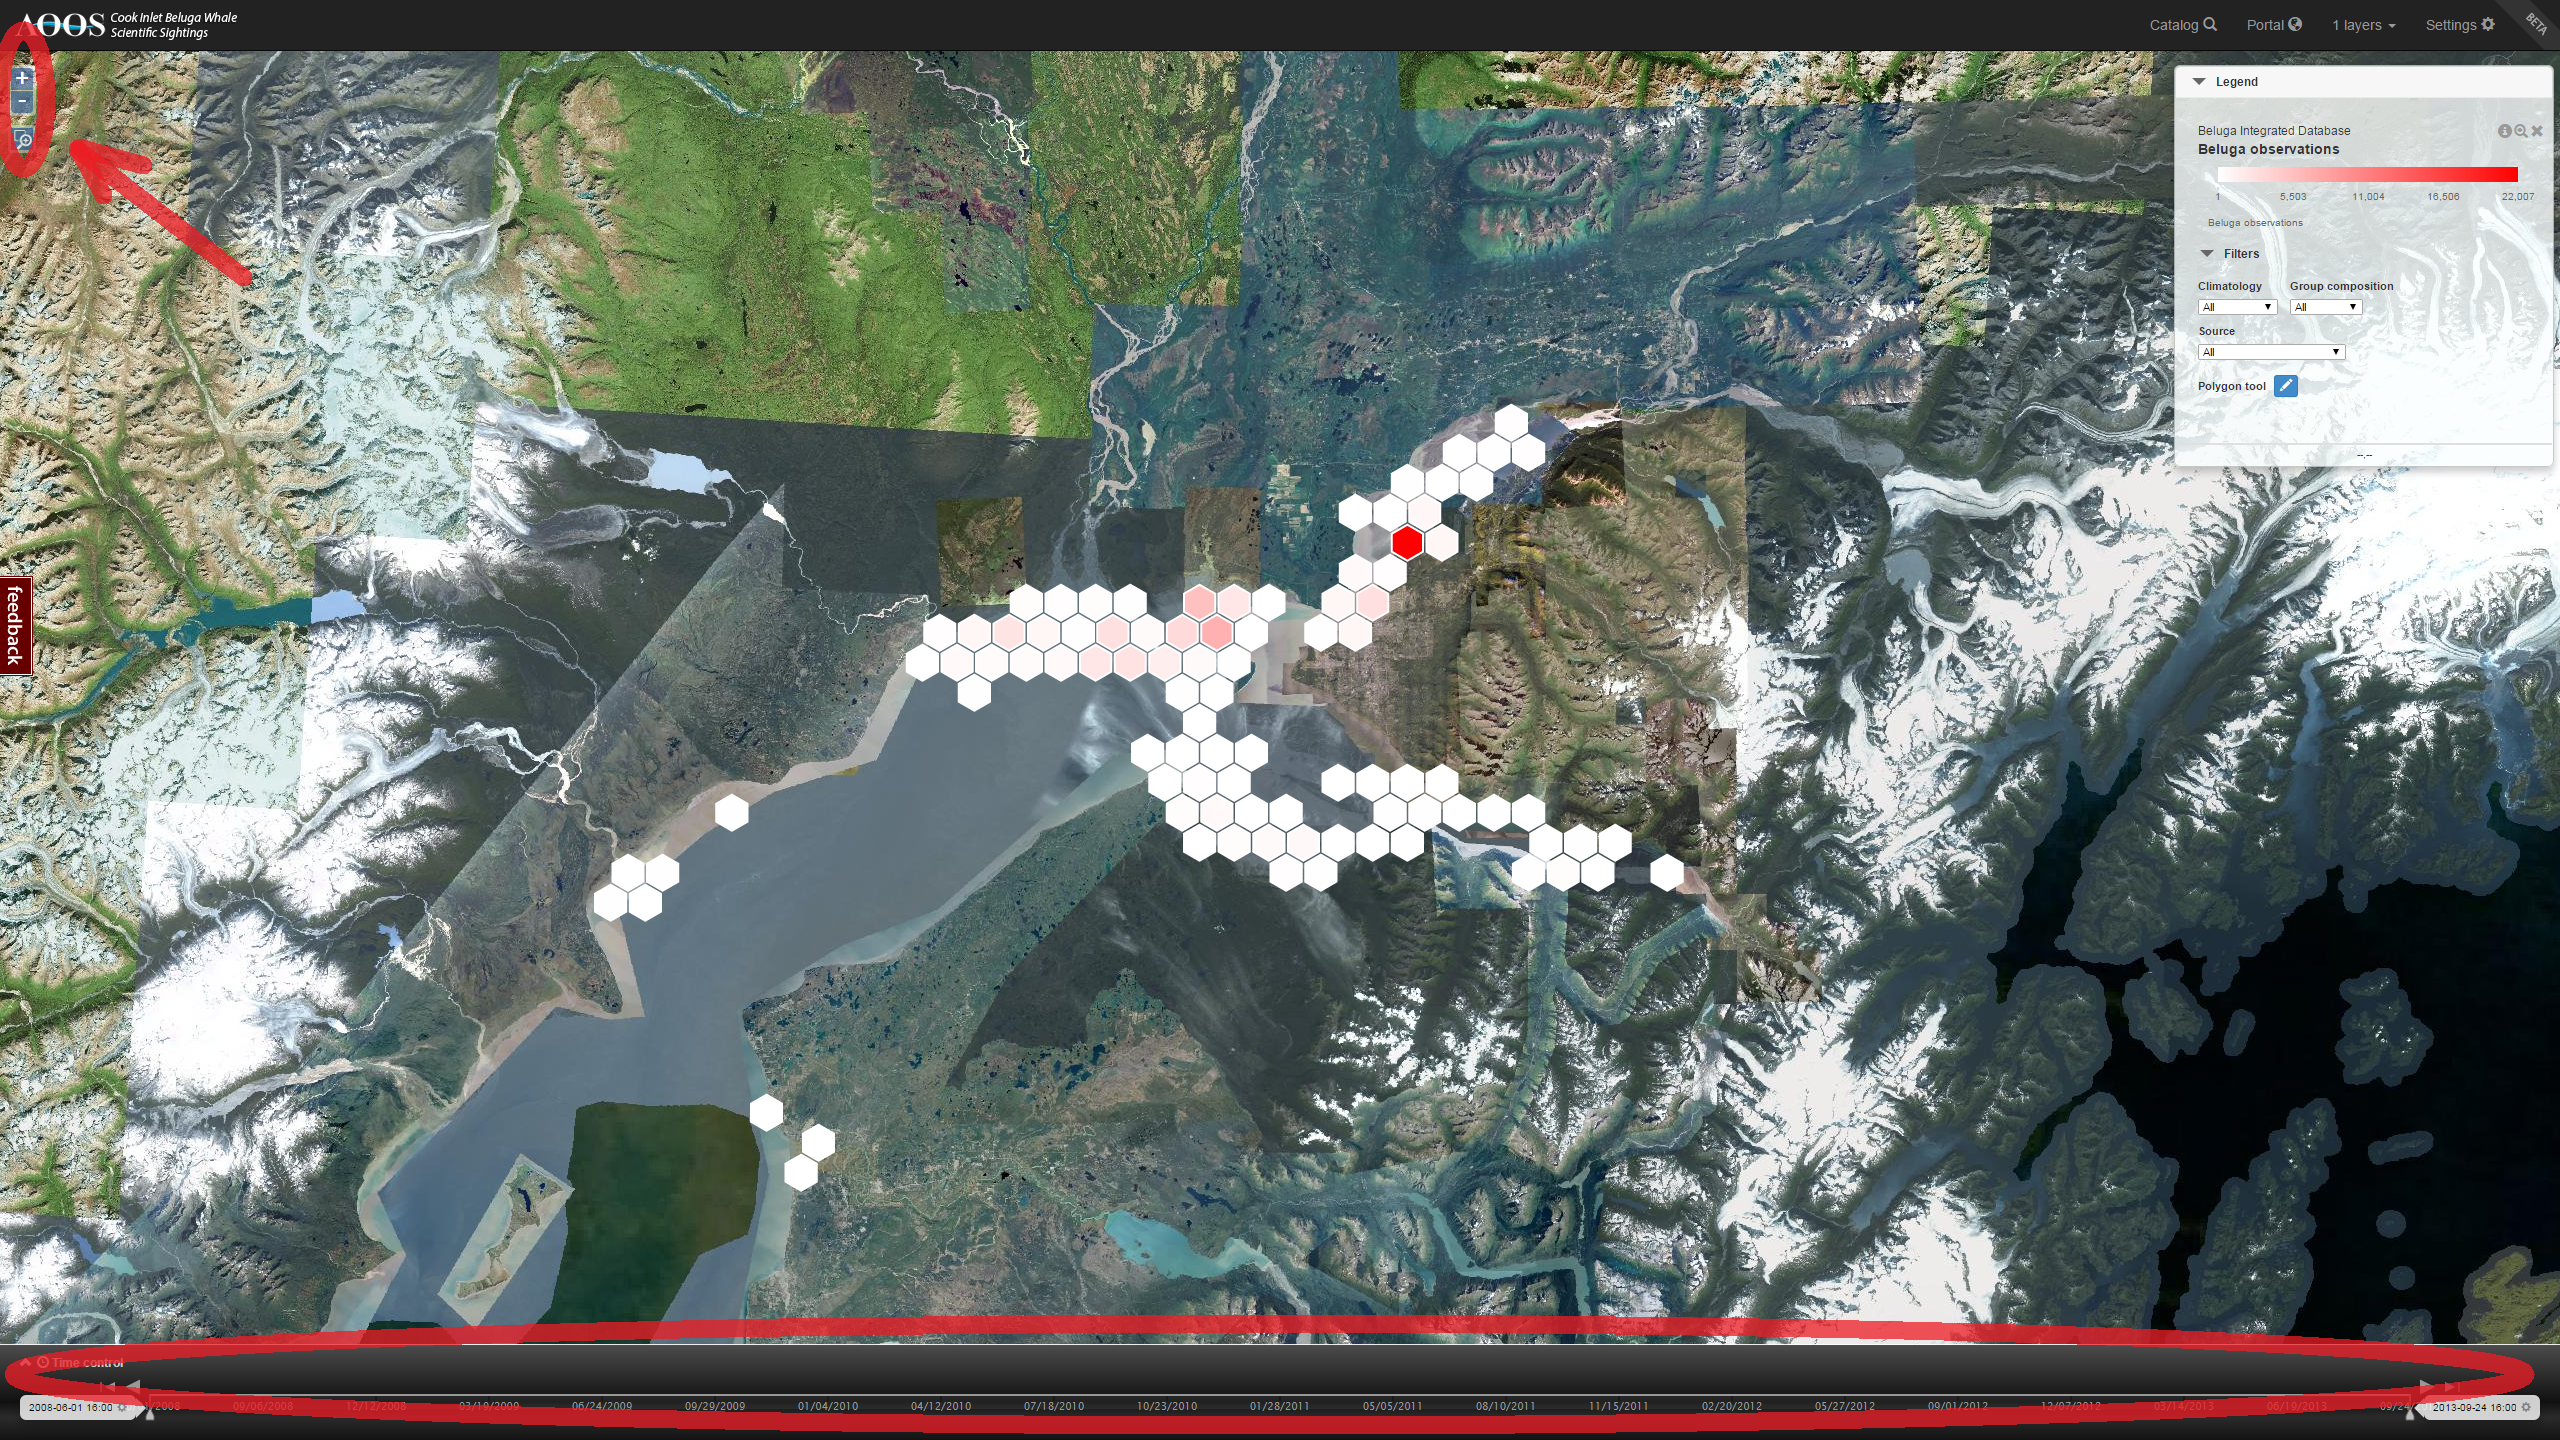
The mapping portal shows sightings summarized in a grid of hexagonal polygons, with red shades for areas with more sightings. The legend in the upper right will adjust to the minimum and maximum number of sightings in your current view.
Hit + and – in the upper left to zoom in and out. You can also see sightings within a date range by adjusting the ‘Time control’ sliders or entering a date.
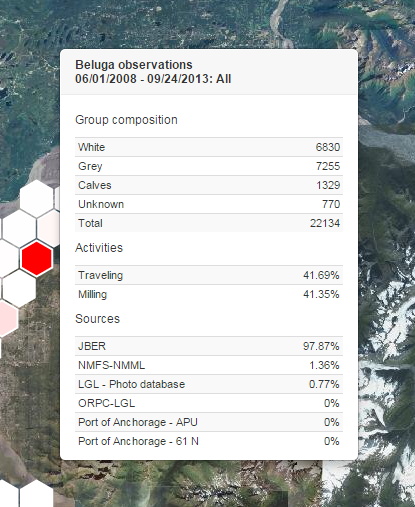
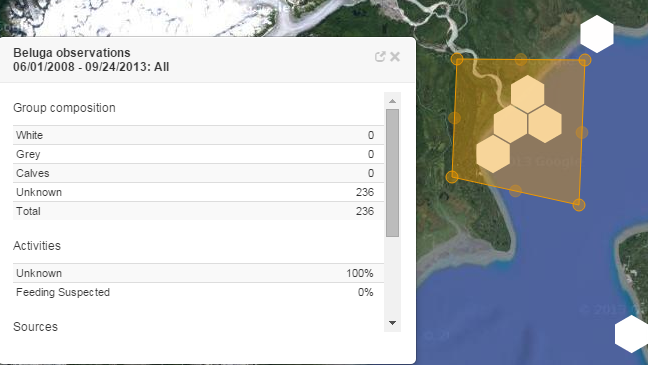
Hover your cursor over one of the hexagonal cells to see a summary of beluga observations. Be aware that this is the number of observations, not whales. Different organizations collect whale data differently, so comparisons between agencies and areas is not directly possible with this portal. Again, please read the Disclaimer and User Agreement.
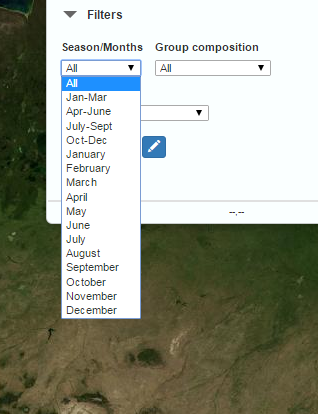
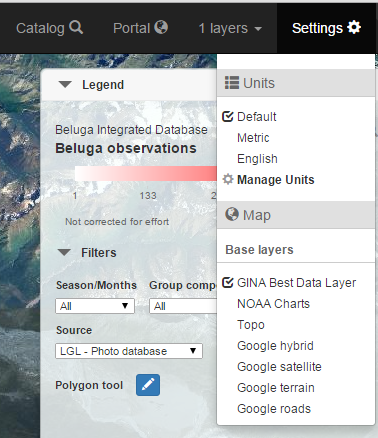
You can filter the sightings on the map by climatology (month, season), group composition (White whales, All whales, etc), or the data source.
After filtering by source you can ‘Display the sightings area’ to see the sampling grid used or tracks of survey flights.

The polygon tool below the filters can be used to get a summary of belugas in a specific area.
You can customize your view by hitting settings in the upper right to change the base layer.
By clicking on the gear in legend you can adjust layer opacity/transparency.

You can see information about the layer such as who provided the sightings records by hitting the ‘info’ logo, or catalog button.

Click Portal to return to the map.
Comments or suggestions? AOOS and the National Marine Fisheries Service are interested in your feedback – look for the tab on the left side of the screen, leave us a message, and we’ll try to get back to you promptly. Thank you!