
Click to enlarge
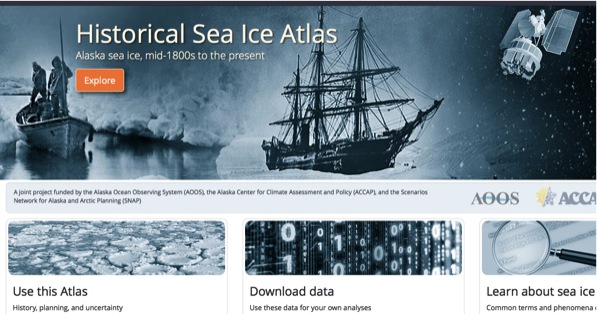
The atlas allows users to view and download sea ice concentration data around Alaska from 1850 to the present.
New atlas provides 160 years of historical data at your fingertips
The Alaska Ocean Observing System (AOOS), Alaska Center for Climate Assessment and Policy (ACCAP), and Scenarios Network for Alaska and Arctic Planning (SNAP) are pleased to announce release of the first ever digital atlas of historical sea ice concentration for the Beaufort, Chukchi, and Bering Seas.
This web-based tool allows users to view and download sea ice concentration data around Alaska from 1850 to the present. Explore the Atlas.
What’s in the Atlas?
One of the unique aspects of the Atlas is that it provides digitized historical sea ice data compiled from over ten different sources including the satellite record (1979-present), various US Naval and National Ice Center compilations (1950s to 1990s), Canadian records (1950s to 1980s), Danish and Norwegian ship records (mid-1800s to 1970s), and whaling ship reports (1850-1900).
The interactive map allows users to select particular dates and locations, animating how open water seasons have varied in time and space. The tool can return specific data requests in both graphic and map formats. Additionally, the Atlas offers a glossary that defines different types of sea ice and provides information about the original data sources and how the data were compiled.
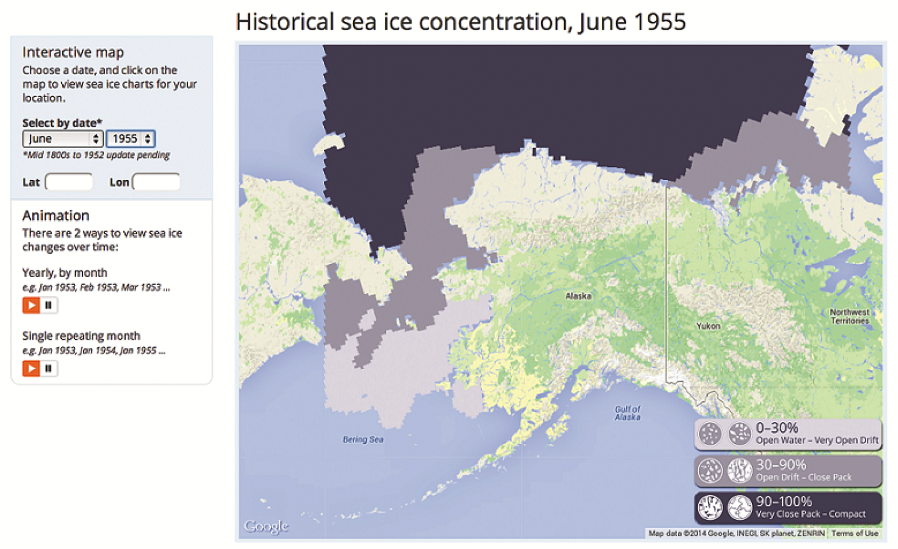
The interactive map allows users to select by date and/or location to view graphs and animations of sea ice extent and concentration over time.
Who will use the Atlas?
One of the objectives of the project is to offer researchers a reliable tool to find time scales of variability. “Is there a 20-year cycle in sea ice?” asks lead scientist John Walsh. “That is a research question. Researchers want to know about it scientifically. If you only have 30 years of data, it’s really hard to say there is a 20-year cycle. But when you get to 160 years, you can start to see if any cycles hold up over time, whether they are reliable, robust enough to be considered real.”
Researchers are not the only ones who will benefit from the Atlas. It provides coastal communities, industry, and state and federal agencies, among others, an objective, historical record of sea ice conditions over the past 160 years. The Atlas can also be an educational tool for classrooms. Anyone with web browser and Internet access is able to use the tool.
The Project Team
With support from AOOS, John Walsh, Chief Scientist at UAF’s International Arctic Research Center (IARC), and Sarah Trainor, director of IARC’s research unit ACCAP have led the project over the past two years in partnership with the National Snow and Ice Data Center (NSIDC) and the University of Illinois, Urbana-Champaign. IARC’s SNAP maintains the data behind the Sea Ice Atlas, which is complementary with other data available at AOOS.
For more information on the project, contact John Walsh (jwalsh@iarc.uaf.edu, 907-474-2677) or Lena Krutikov (lkrutikov@alaska.edu, 907-474-6961).