
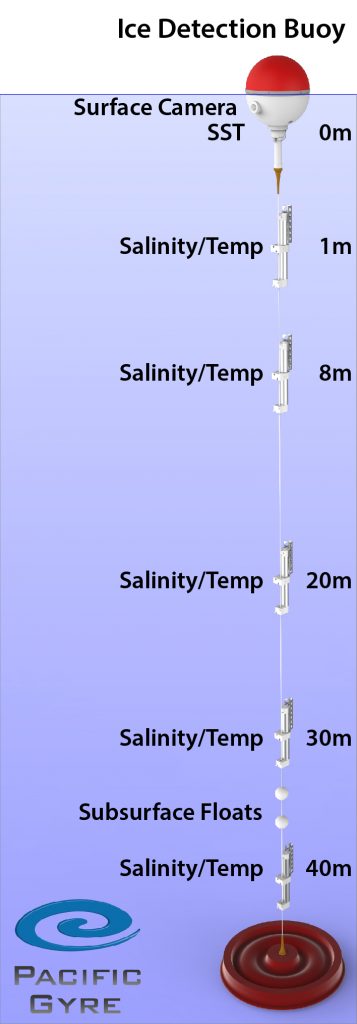
Schematic of the proposed ice detection buoy with surface float containing Iridium satellite communications and burn wire, inductive cable with 4 microCAT CTDs, floatation, and bottom weight with acoustic release assembly.
Researchers at the University of Alaska Fairbanks School of Fisheries and Ocean Sciences and industry partner Pacific Gyre developed and deployed an economical sensor package attached to a buoy to provide real-time data on the vertical temperature and salinity structure of the location to determine freeze-up conditions. A mooring was designed that could provide full water column heat content and stratification data in real time to scientists at the University of Alaska Fairbanks (UAF), forecasters at the National Weather Service (NWS), and others. The Ice Detection Buoy, also referred to as the Freeze-up Detection Mooring, was the result of this effort, and is a deployable a package outfitted with an expendable surface float that houses a satellite communications package, a tether release, an inductive modem, and a sea surface temperature sensor. The surface float is connected to four Sea-Bird Electronic’s SBE 37 inductive modem CTDs that transmitted hourly temperature, conductivity and pressure to the surface float from four subsurface depths (8, 20, 30, and 40 m), along with a sub-surface camera that was intended to record and send digital images of the upper water column. The camera portion never worked. From these data, salinity and density are computed. This methodology allows for only a small expendable portion of the mooring to be lost to ice while providing much needed real-time water column stratification information running up to freeze-up.
This project had no dedicated vessel time of its own, so the deployment test site was selected to be co-located with the Chukchi Ecosystem Observatory (CEO) in the NE Chukchi Sea, a site which hosts annual visits by oceanographic vessels. The CEO is an AOOS-supported multi-mooring installation that records physical, chemical, biological and geological data sets.
AOOS and Axiom Data Science partnered on this project by helping with real-time data display and management and outreach.
Notable Successes
- The project resulted in 3 deployments of the prototype Ice Detection Buoy in 2015, 2017, and 2018.
- The designed mooring system collected data from throughout the water column on the 45 m deep Chukchi Sea shelf and transmitted these data in real time during the 2015 and 2017 freeze-up cycles.
- In 2015, the expendable surface float was successfully separated from the subsurface mooring at the instruction of a remotely triggered command. This was sent as the water column mixed-down completely, indicating the immanent onset of freeze-up, while newly forming sea ice detected by daily satellite imagery was nearly running over the mooring site.
- The National Weather Service (NWS) liked the data from the project enough to support developing a 2nd Ice Detection Buoy for deployment in 2017, with data utilized by the NWS ice forecasters.
- A third deployment of a lesser-instrumented (lower cost) mooring was carried out in 2018 with logistical support from IOOS, though the deployment was cut short due to drifting ice interference not long after the buoy was put in the water.
Challenges to the project included:
- The loss of the initial 2015 subsurface mooring sometime in 2016, likely due to ice keel drag, or possibly a failed acoustic release;
- The slightly premature release of the 2017 mooring surface float just before freeze-up was definitive, likely due to large waves;
- The movement of the 2015 and 2018 buoys due to ice and the failure of the surface float in 2018 due to impact by a drifting sea ice, which destroyed the iridium antennae.
Important lessons learned from these experiences is the need to carefully layout the depth of subsurface flotation to avoid ice-drag, and to target the deployment conditions, as deployment too early in the season in conditions of heavy ice carries great risk. More detailed summaries from each deployment is provided below.
2015 Deployment Number 1
The first prototype ice detection buoy (IDB) (see Schematic) was deployed on September 6, 2015 approximately 76 miles NNW of Wainwright in the Chukchi Sea. Advance of the fall ice pack was closely monitored with satellite imagery and the surface float provided simultaneous real-time monitoring of the temperature and salinity throughout the water column leading up to ice formation. When the ice edge advanced close to the mooring and sparse ice chunks were floating by and the water column was completely mixed, the surface float was remotely released from the mooring, leaving a mid-depth float to provide buoyancy for the subsurface portion left behind. The signal to release the surface float from the buoy was sent at 10pm (AKST) on November 6, 2015. The surface float and sea-surface temperature sensor were then drifting free, and sensors at depth were disconnected and remained with the bottom anchor. The surface float continued to report it’s position and surface temperature as it drifted away from the mooring site, while subsurface mooring sensors continue to internally record data through the winter months, but no longer able to communicate their data through the inductive modem to the surface float. At 1pm on December 6th, 2015, the freely-drifting surface buoy was surrounded by sea ice and sent back it’s last position and temperature recording. This mooring was not recovered in 2016.
2017 Deployment Number 2
A second (new, but identical) IDB was deployed in 2017 with added added support from the National Weather Service (NWS). This new ice detection system was modified to avoid potential drag by ice keels, which were suspected the cause of the 2015 mooring disappearance. This 2nd buoy successfully transmitted real time data through the WMO GTS data system for use by ice forecast modelers within the NWS (Buoy WMO 4801730). Unlike the first deployment, the surface release mechanism was tripped by some natural forcing — possibly waves — on November 8, 2017 at around 10:05 AM (19:05 UTC). In other words, it was not remotely released by a human. Fortunately, this occurred after the mixdown of the water column, so near to the expected time of freeze-up. This mooring was successfully recovered in 2017 and the subsurface data will be added to the rest of the pre-freeze-up time series to assemble 1 year of observations.
2018 Deployment Number 3
The third IDB deployment took place in August 2018. The plan was to stream data real time through the WMO GTS again (WMO 4801730). However, this deployment occurred with many ice floes in the area and the mooring transmitted only for a couple of days before losing contact. With collegial assistance from collaborators in the field, a research vessel was diverted to recover the mooring in September. Ship technicians found a weak acoustic signal and they determined that the mooring had been dragged by more than a kilometer away from the deployment site. The surface float was cracked and flooded and the mooring was returned to Seward aboard R/V Sikuliaq.
Access to the IDB Observations
- 2015 Ice Detection Buoy Data
- 2017 Ice Detection Buoy Data
- 2018 Ice Detection Buoy Data (No data)
Who Will Use This Information?
There is considerable interest in the offshore exploration, and possible development, of hydrocarbon resources in Alaska’s Chukchi and Beaufort shelf seas. Drilling activity can only proceed during the open water season, with the extent of that season dictated by sea ice formation, as determined by federal permitting agencies. Federal agencies and the oil and gas industry require an accurate method of predicting sea ice formation since a premature or delayed cessation of marine operations based on inaccuracies in either model predictions or satellite detection of sea ice formation could be costly and have implications for the safety of offshore operations. Oceanographers and forecasters have long struggled with finding a way to measure upper water column stratification and heat content through the fall up to the time of freeze-up in ice-covered seas.
The goal of this project was to develop and test an economical sensor package, using existing sensors in a new manner, which would then be used operationally by a variety of stakeholders needing accurate predictions of the onset of fall ice formation. The proposed sensor system could serve several purposes.
- First, it provides real-time data on the vertical temperature and salinity structure of the shelf so that permitting agencies, and stakeholders, including the oil and gas industry and subsistence users, will know when offshore sea ice formation can begin.
- Second, the data can be used to evaluate and refine NOAA and NWS sea ice forecast models (both existing models and those under development), which depend upon accurately predicting the seasonal evolution of the thermohaline structure of the ocean.
- Third, the data obtained from this sensor system could be useful in guiding remote sensing algorithms for frazil ice detection, a notoriously difficult process for remote sensing platforms.
2017 Data Display
Loading chart
Download data
Sources
Loading chart
Download data
Sources
Loading chart
Download data
Sources
Loading chart