

Click to enlarge
The new real-time sensor map is available through the "Access Data" dropdown menu, or can be added as a layer in the Ocean Data Explorer.
The AOOS Real-Time Sensor map has been revised! The map connects to over 1,300 stations across the state, providing the latest information on air and water temperature, wind, waves, snow depth, and much more. The map is available on the AOOS website and includes the following features:
- Individual stations are clustered to reduce clutter when zoomed out
- Individual stations and sensors can be selected when zoomed in
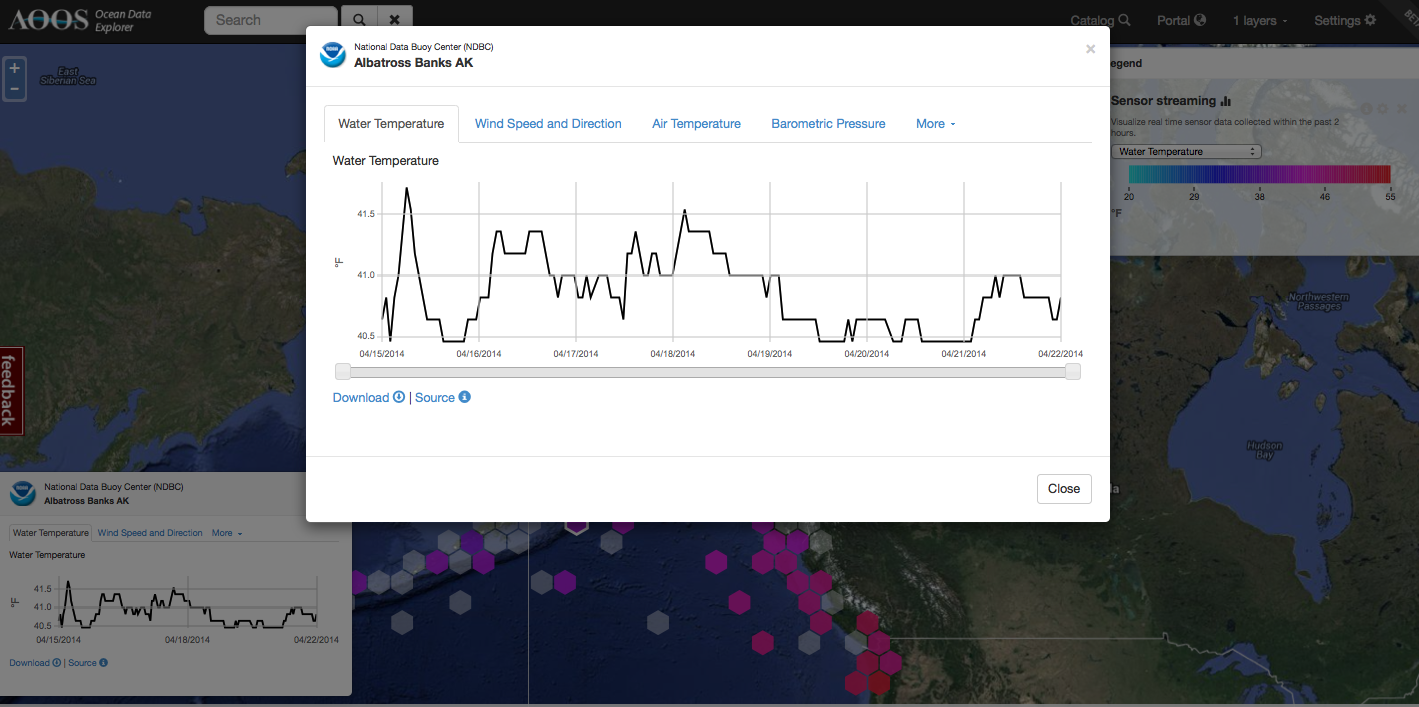
- Click to see the past week’s worth of data, and options for downloading recent data and finding source information
- Dynamic graphs provide overview statistics for individual sensors or regions
- Choose your base layer, including NOAA charts and topography
- Toggle between metric and English units
- Overlay real-time sensors with other data such as model forecasts or GIS layers through the AOOS Ocean Data Explorer. Click “Catalog” at the top of the screen to browse all AOOS data resources
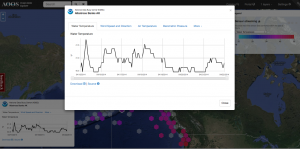
Clicking on stations provides a dynamic graph of each parameter
Visit the new sensor map
Feeling change adverse? You can still access the original map which will be up til September. This map also includes over 100 webcams which are in the process of being transferred to the new map.
We welcome your feedback. Click the Feedback tab on the left side of the screen to provide comments and an AOOS team member will respond.