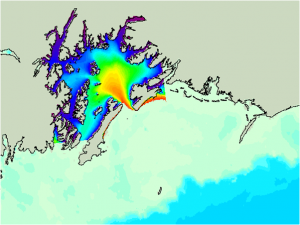
Surface waves constitute an extremely energetic component of the physical oceanography affecting coastal Alaska. In the Gulf of Alaska, waves have been measured at almost 17 meters — the tallest waves ever measured by NDBC buoys.
Modeling on a Finer Scale
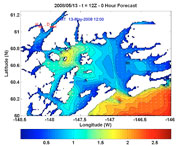
Wave simulations in the Gulf of Alaska currently generate relatively coarse-scale forecasts that are of little value at the fine (small) scale of Prince William Sound.
Information about the wave conditions in the Alaskan coastal areas is needed to assess the fate of oil spills and related recovery efforts and safe boat/ship operations. Because buoy and satellite altimeter measurements of waves in coastal waters suffer from spatial and/or temporal sampling limitations, grid-based wave modeling SWAN is being employed to make wave predictions for both oil spill response and marine safety applications in the Sound.
The SWAN Model
Using SWAN (Simulating WAves in the Nearshore) modeling, Vijay Panchang, head of the Department of Maritime Systems Engineering at Texas A&M University, and his colleagues have been forecasting waves around the country up to 48 hours in advance based on measurements from NDBC buoys. Placing this modeling system in the Sound allows for forecasts that are accurate to within 500 meters.
The SWAN model was developed in Holland and is being used in more than 50 countries to predict wave heights in nearshore and inland waters. It has been used to accurately predict waves in the Gulf of Maine for nearly two years.
How SWAN Works
SWAN simulates the following physical phenomena:
- Wave propagation in time and space, shoaling, refraction due to current and depth, frequency shifting due to currents and nonstationary depth
- Wave generation by wind
- Nonlinear wave-wave interactions (quadruplets and triads)
- Whitecapping, bottom friction, and depth-induced breaking
- Blocking of waves by current
The SWAN model uses data collected from the three NDBC buoys for validation in the Sound, as well as data from the Cape Suckling and Cape Cleare buoys to validate Gulf of Alaska waves. The model runs every 12 hours to track and predict wave heights. In addition, new technology is being developed by the research group at Texas A&M University that will allow for real-time wave forecasts that are nearly exact for up to six hours at a time. Once it is fully developed, this technology can easily be added to the SWAN modeling system.
SWAN Modeling in Prince William Sound
The SWAN model uses data collected from the three NDBC buoys for validation in the Sound, as well as the Cape Suckling and Cape Cleare buoys to validate Gulf of Alaska waves. The model runs every 12 hours to track and predict wave heights. In addition, new technology is being developed by the research group at TAMU that will allow for real-time wave forecasts that are nearly exact for up to six hours at a time. Once it is fully developed, this technology can easily be added to the SWAN modeling system.
In the summer of 2005 the NDBC buoys tracked waves in PWS with maximum wave heights of six to seven meters during peak wave periods. The results presented demonstrated the modeling scheme’s ability to predict such events with reasonable accuracy. Accurately forecasting these tall waves, or waves of any magnitude, could help prevent future disasters. It could also help researchers determine the importance of waves in sediment transfer, and especially how the movement of sediments affects marine life around the Sound.
Most of the local-scale terrain-driven circulations are strongest on the periphery of the Sound (ends of fiords and such) that are not instrumented. However, it is unreasonable to instrument every nook and cranny of the area. The quality of the data will clearly vary with the instrument platform, and real time data is always subject to errors. Still, the data is of sufficient quality and quantity to reasonably verify a mesoscale atmospheric model.
The best measure of skill for a particular day’s forecast is to use an ensemble method. This allows for an ensemble of forecasts where statistics are compiled at every grid point using several forecasts with slightly perturbed initial states or model physics.
Validating Model Results in the Field
Researchers use satellite and in-situ wave observations for validation of model results and satellite wind and wave observations for data assimilation to enhance model results. Besides traditional data assimilation schemes, they will explore techniques of artificial intelligence to incorporate satellite measurements into wave model results.
In the summer of 2005, NDBC buoys tracked waves in the Sound with maximum wave heights of six to seven meters during peak wave periods. The results demonstrated the model’s ability to predict such events with reasonable accuracy.
During the 2009 Field Experiment, hourly observations were compared with nearest contemporary points on the model grid. Along with straight-up run-by-run comparisons of predicted vs observed fields of wind speed, direction, temperature and pressure, accumulated RMSE and bias were computed for each selected station. In some areas (main body of the Sound) the observation density was enough to pick up the mesoscale processes that the model is expected to produce.
TAMU is using satellite and in situ wave observations for validation of model results and satellite wind and wave observations for data assimilation to enhance model results. Besides traditional data assimilation schemes, TAMU will explore techniques of artificial intelligence to incorporate satellite measurements into wave model results.


